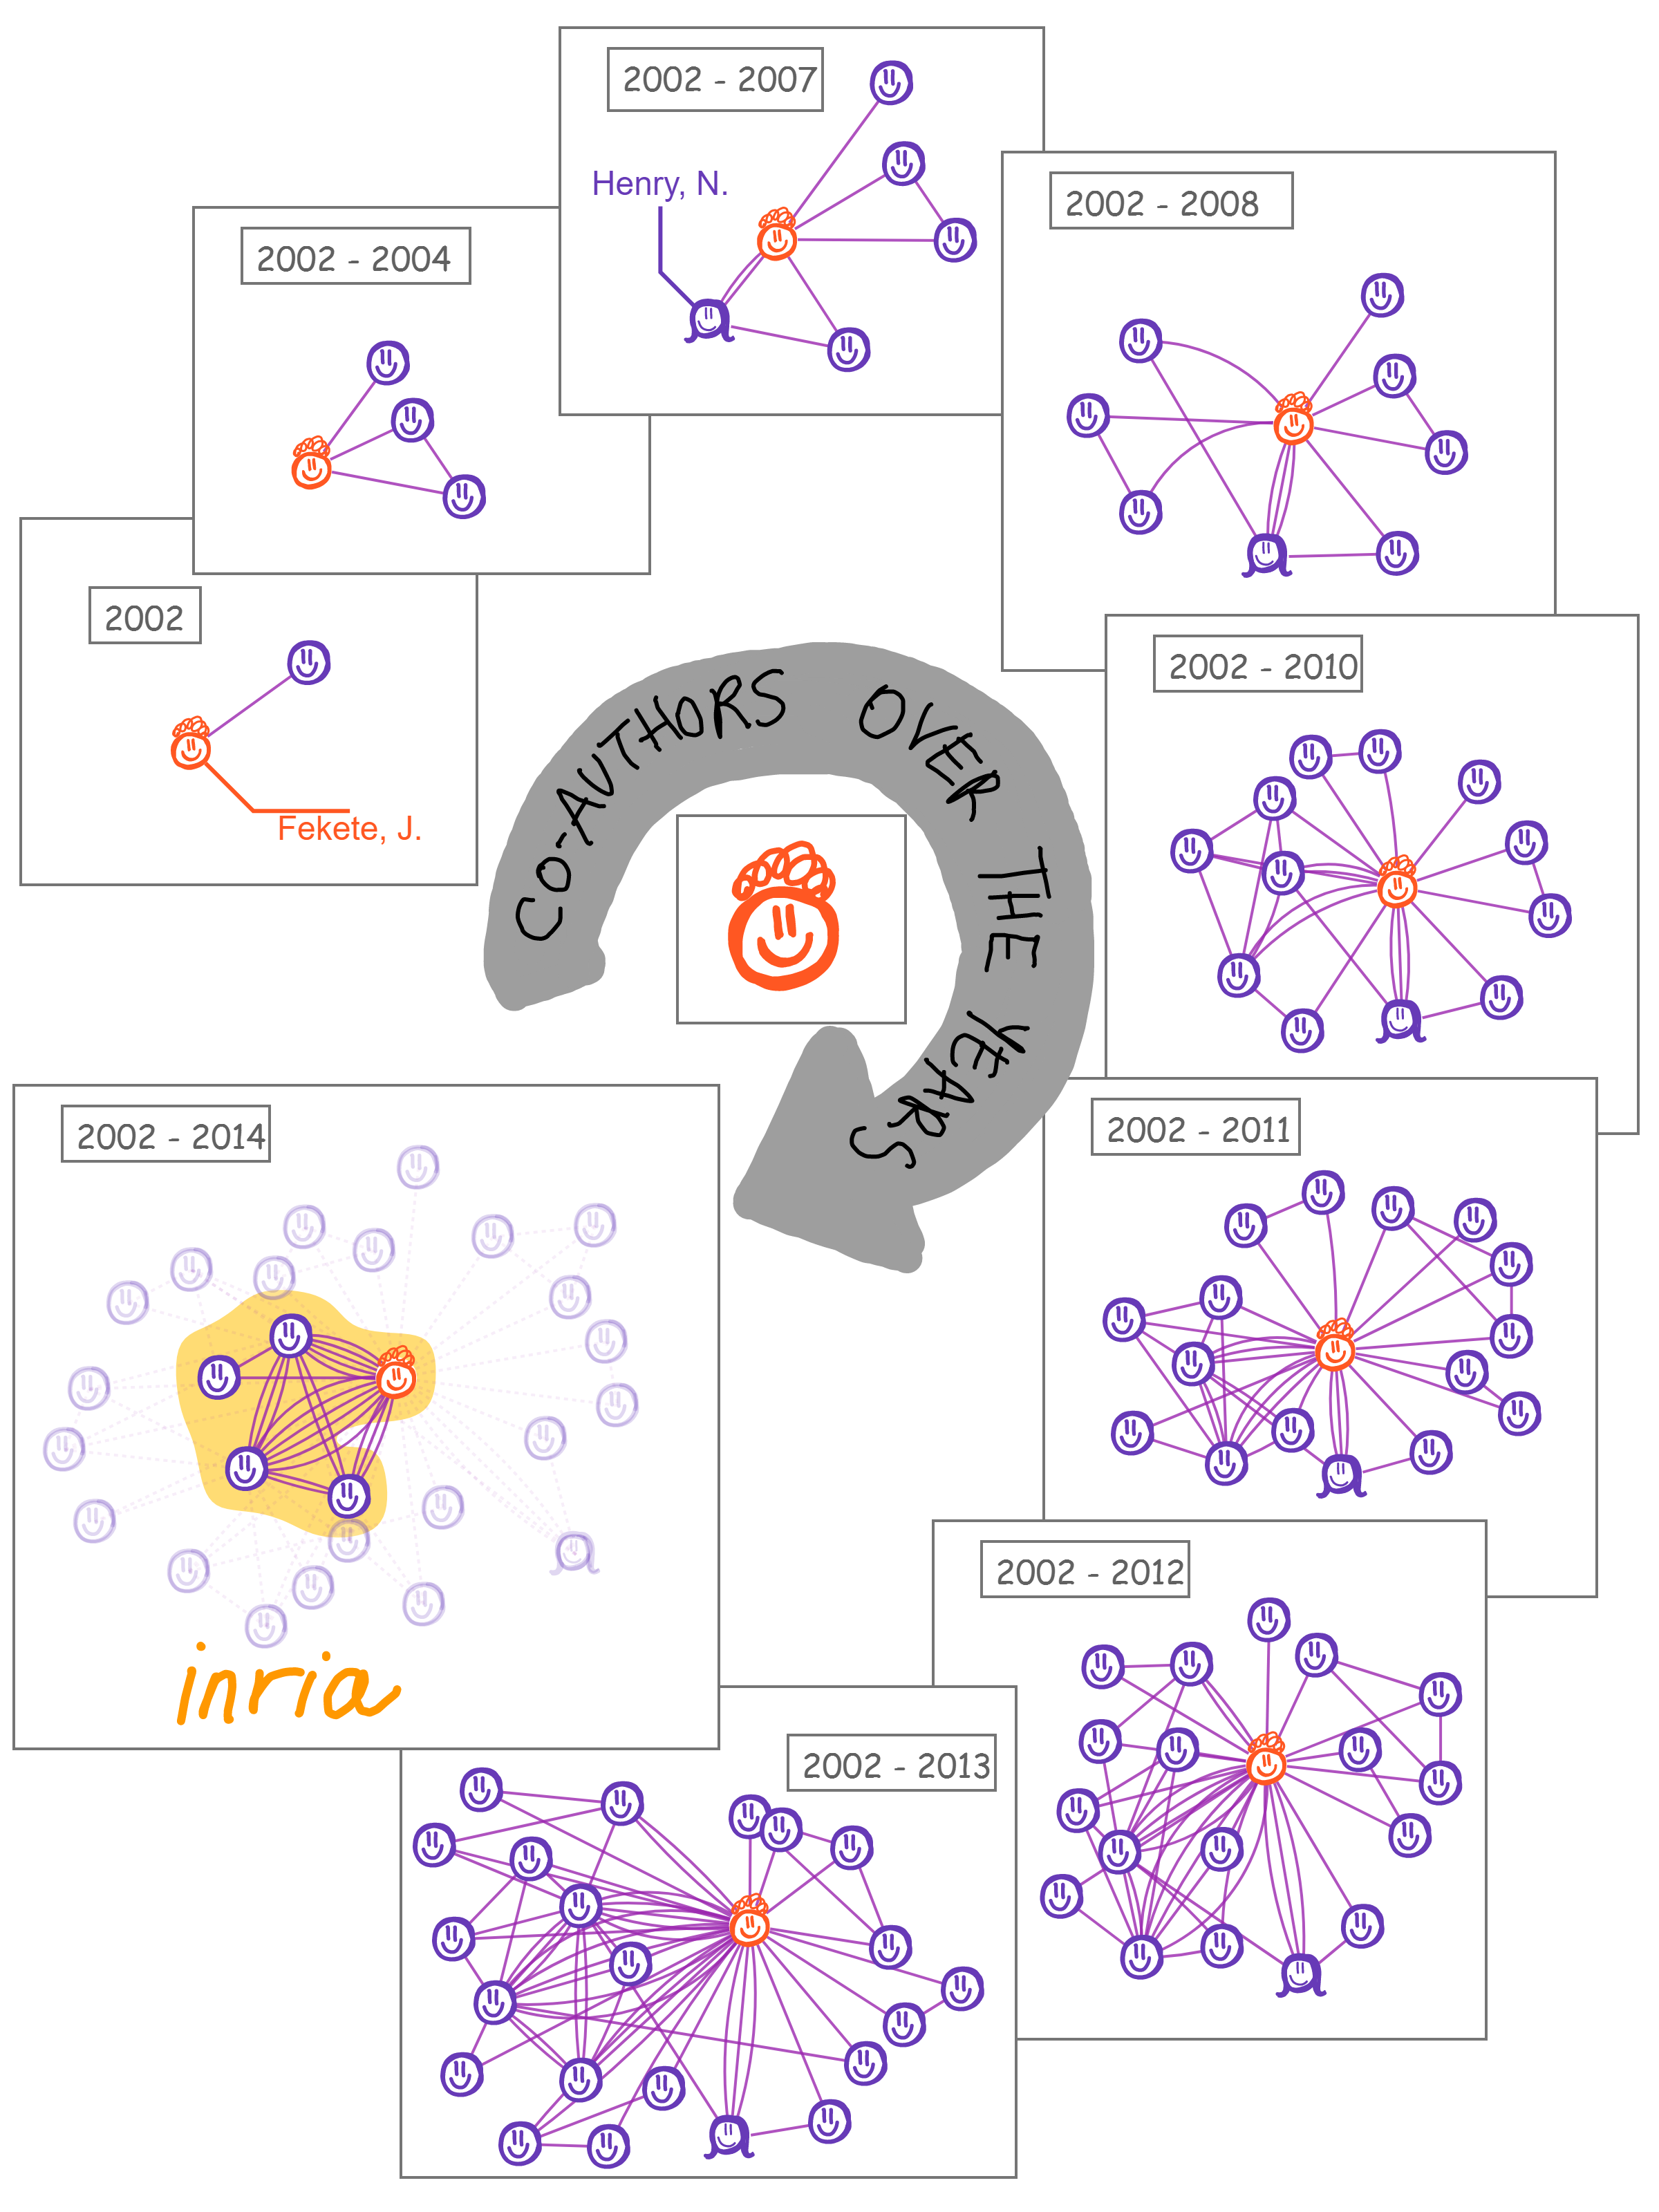
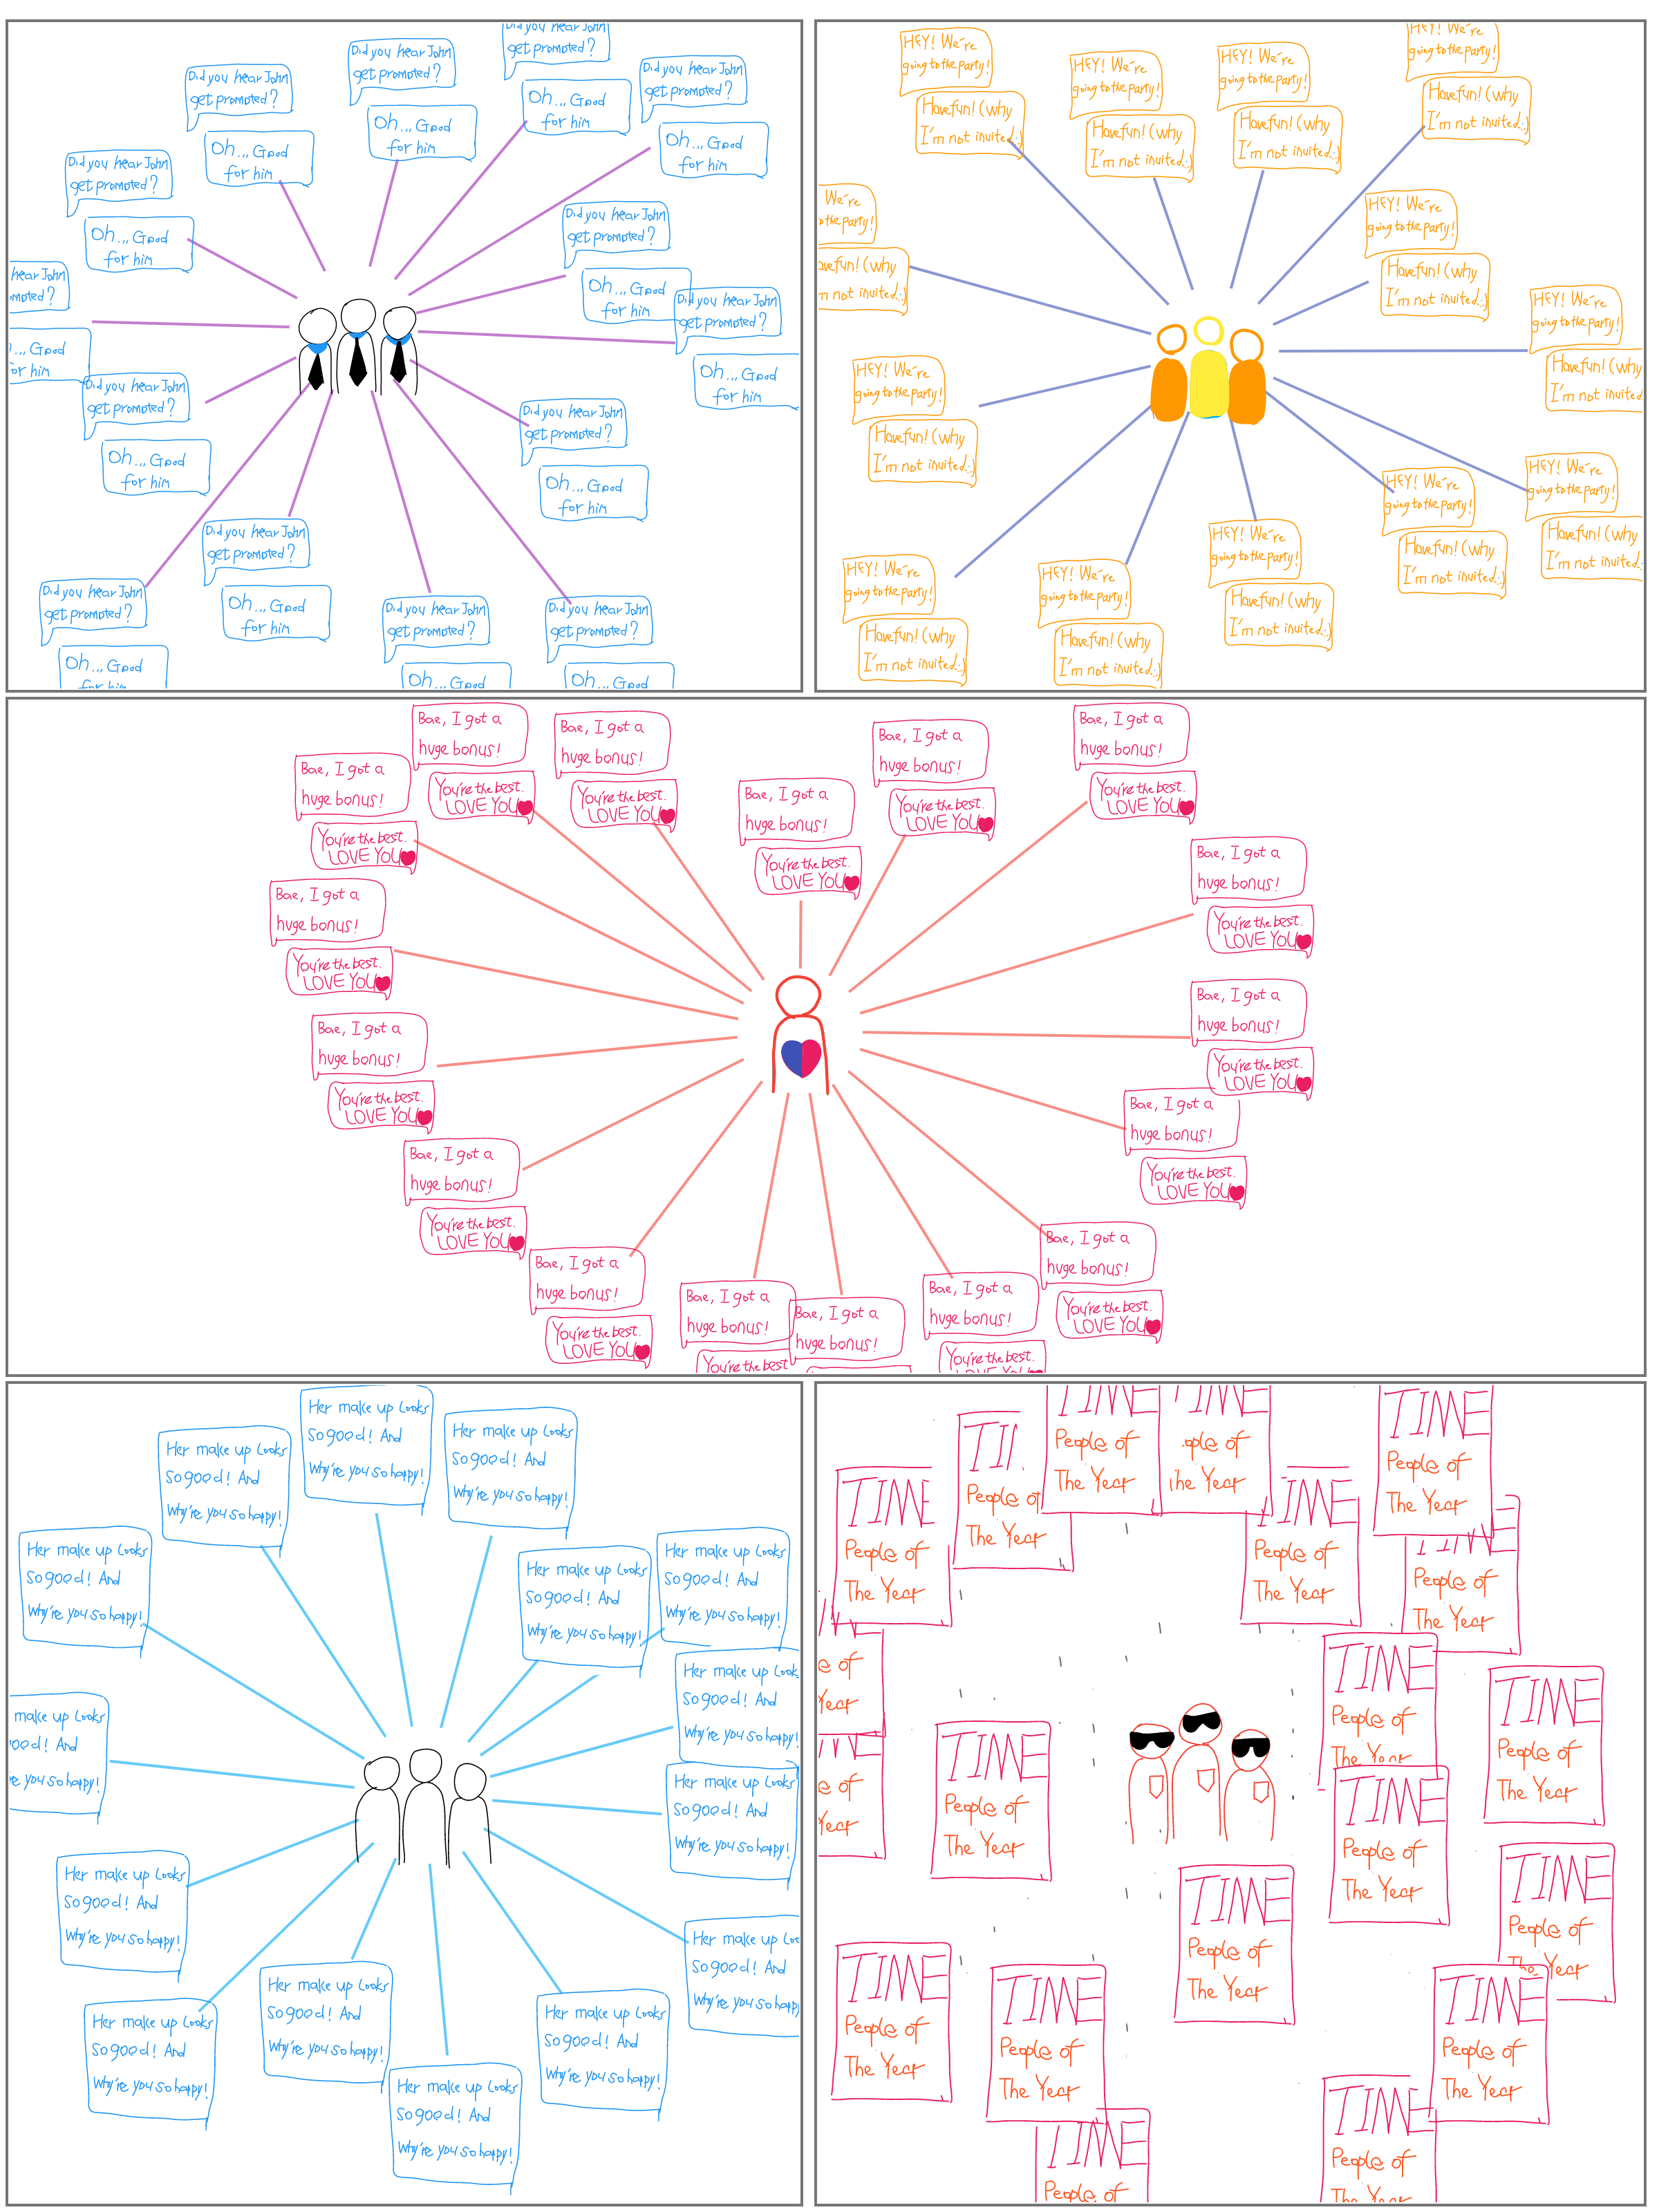
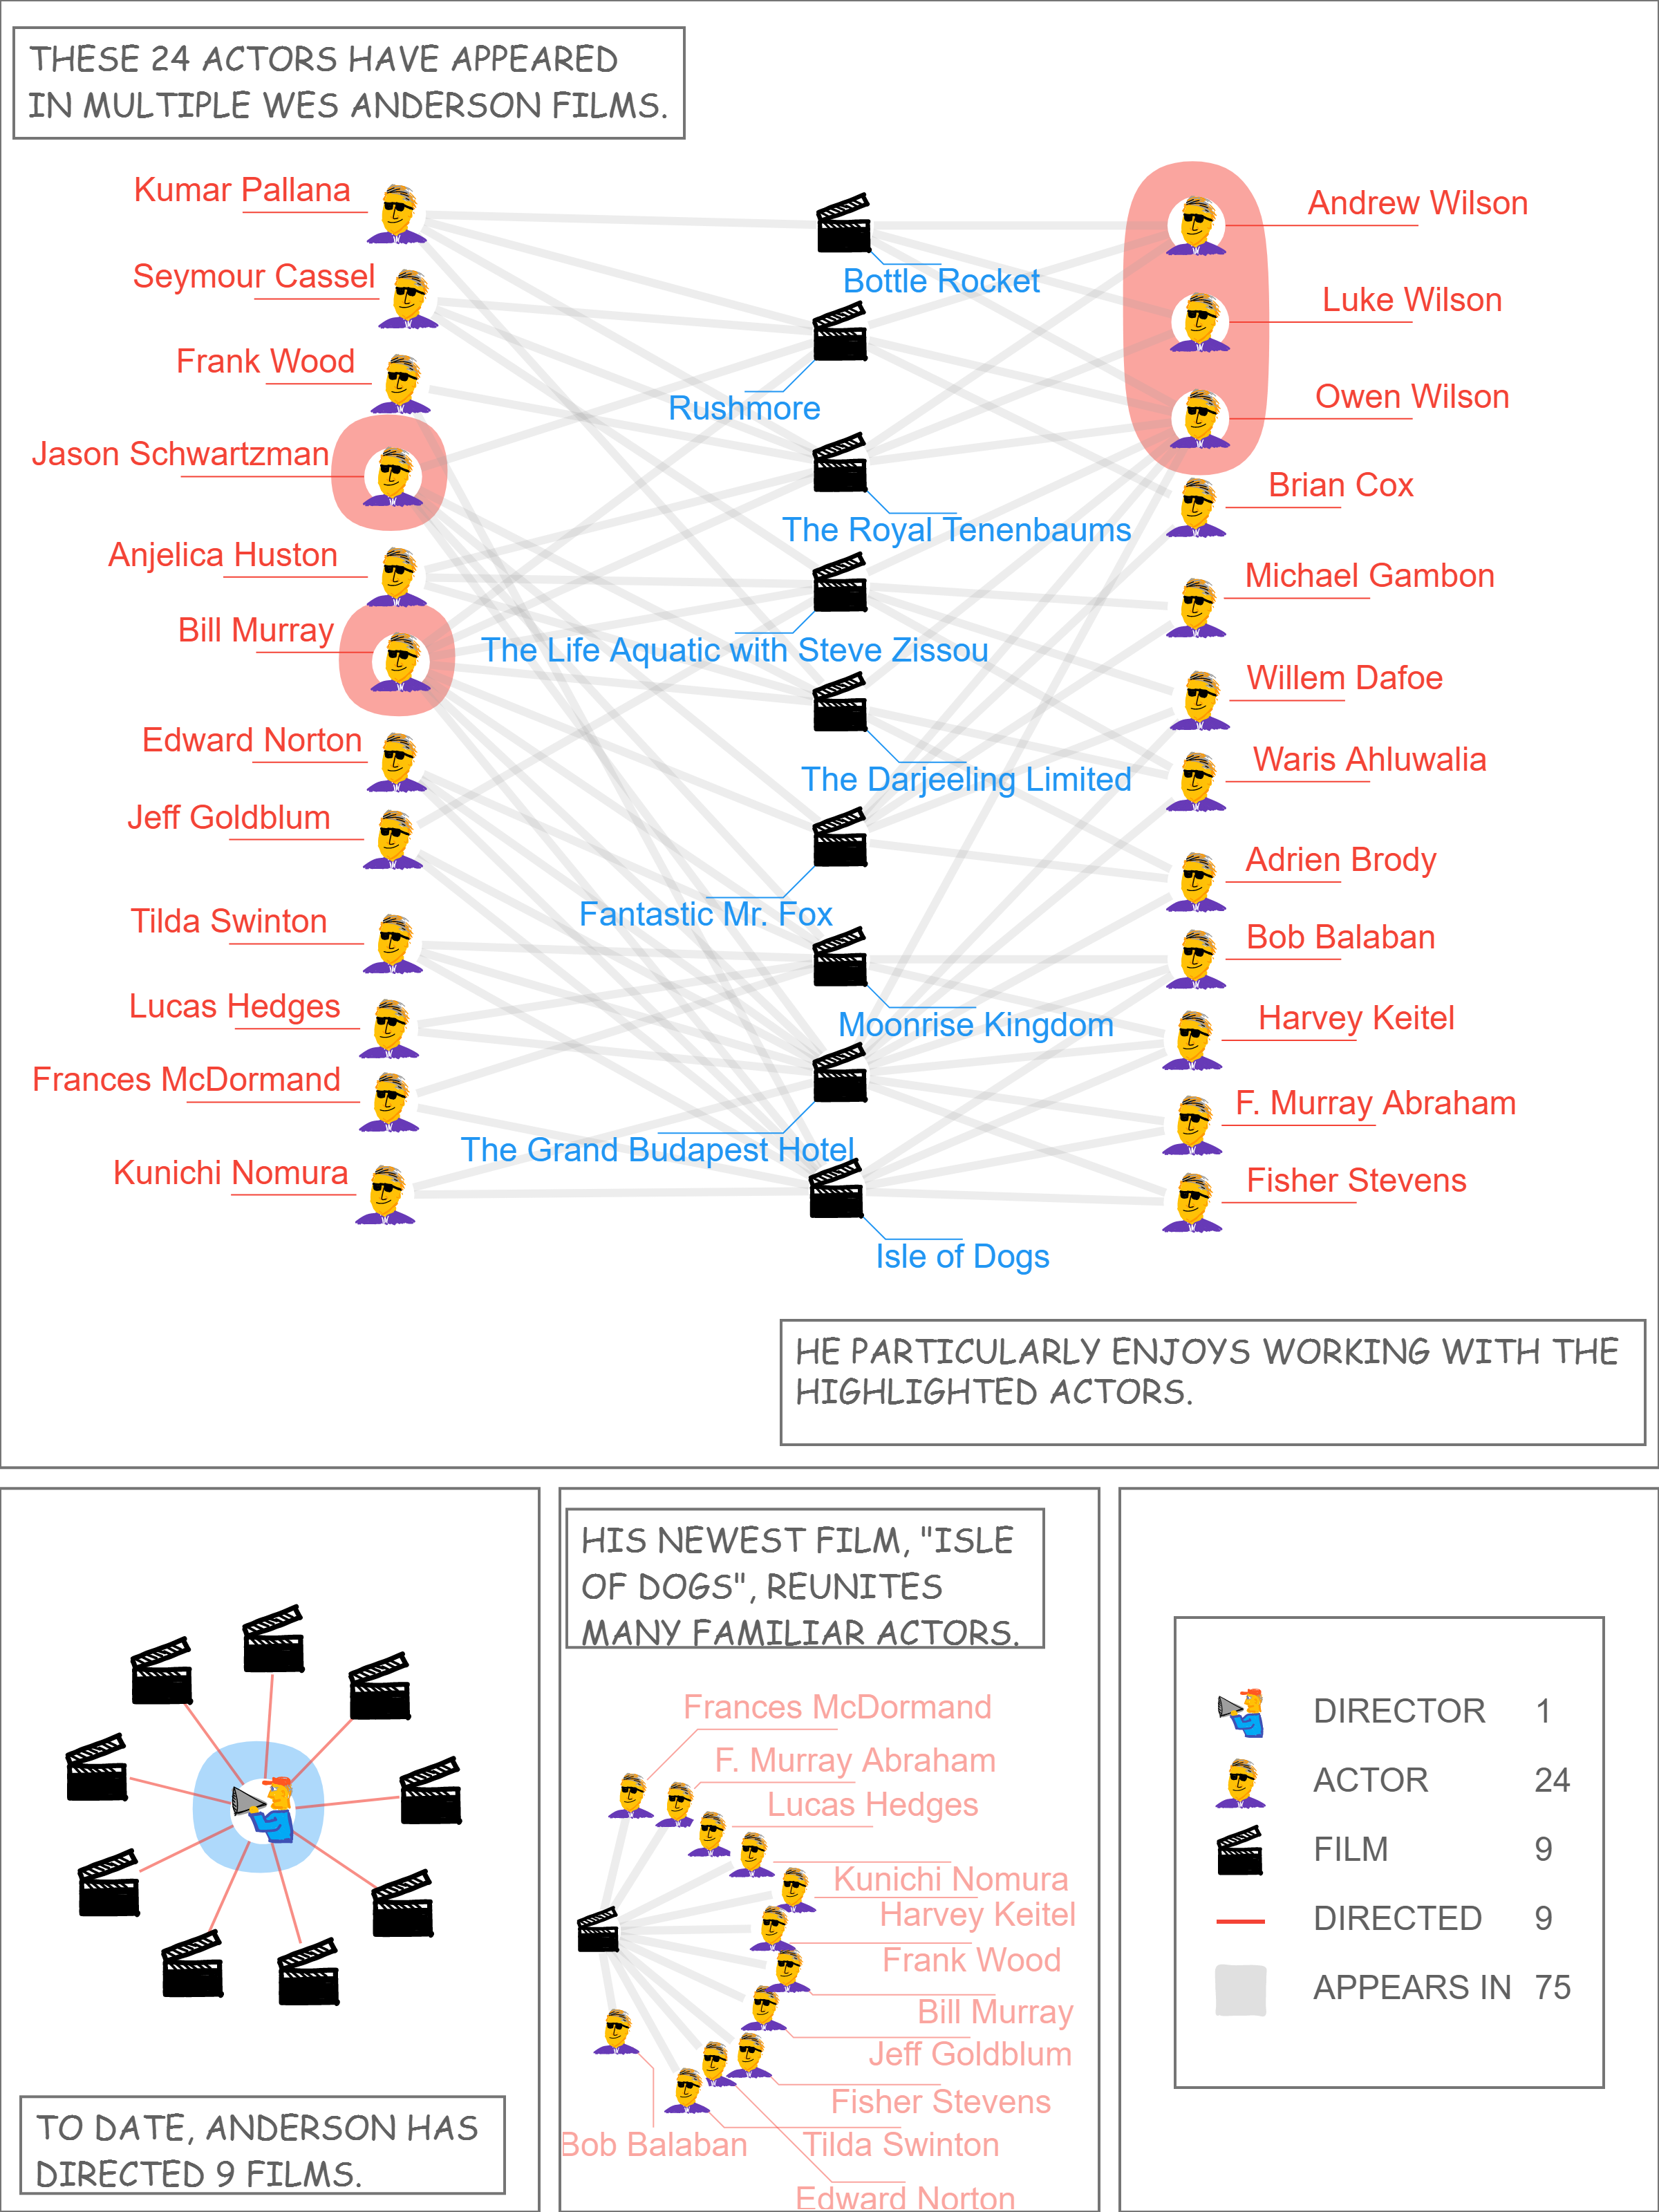
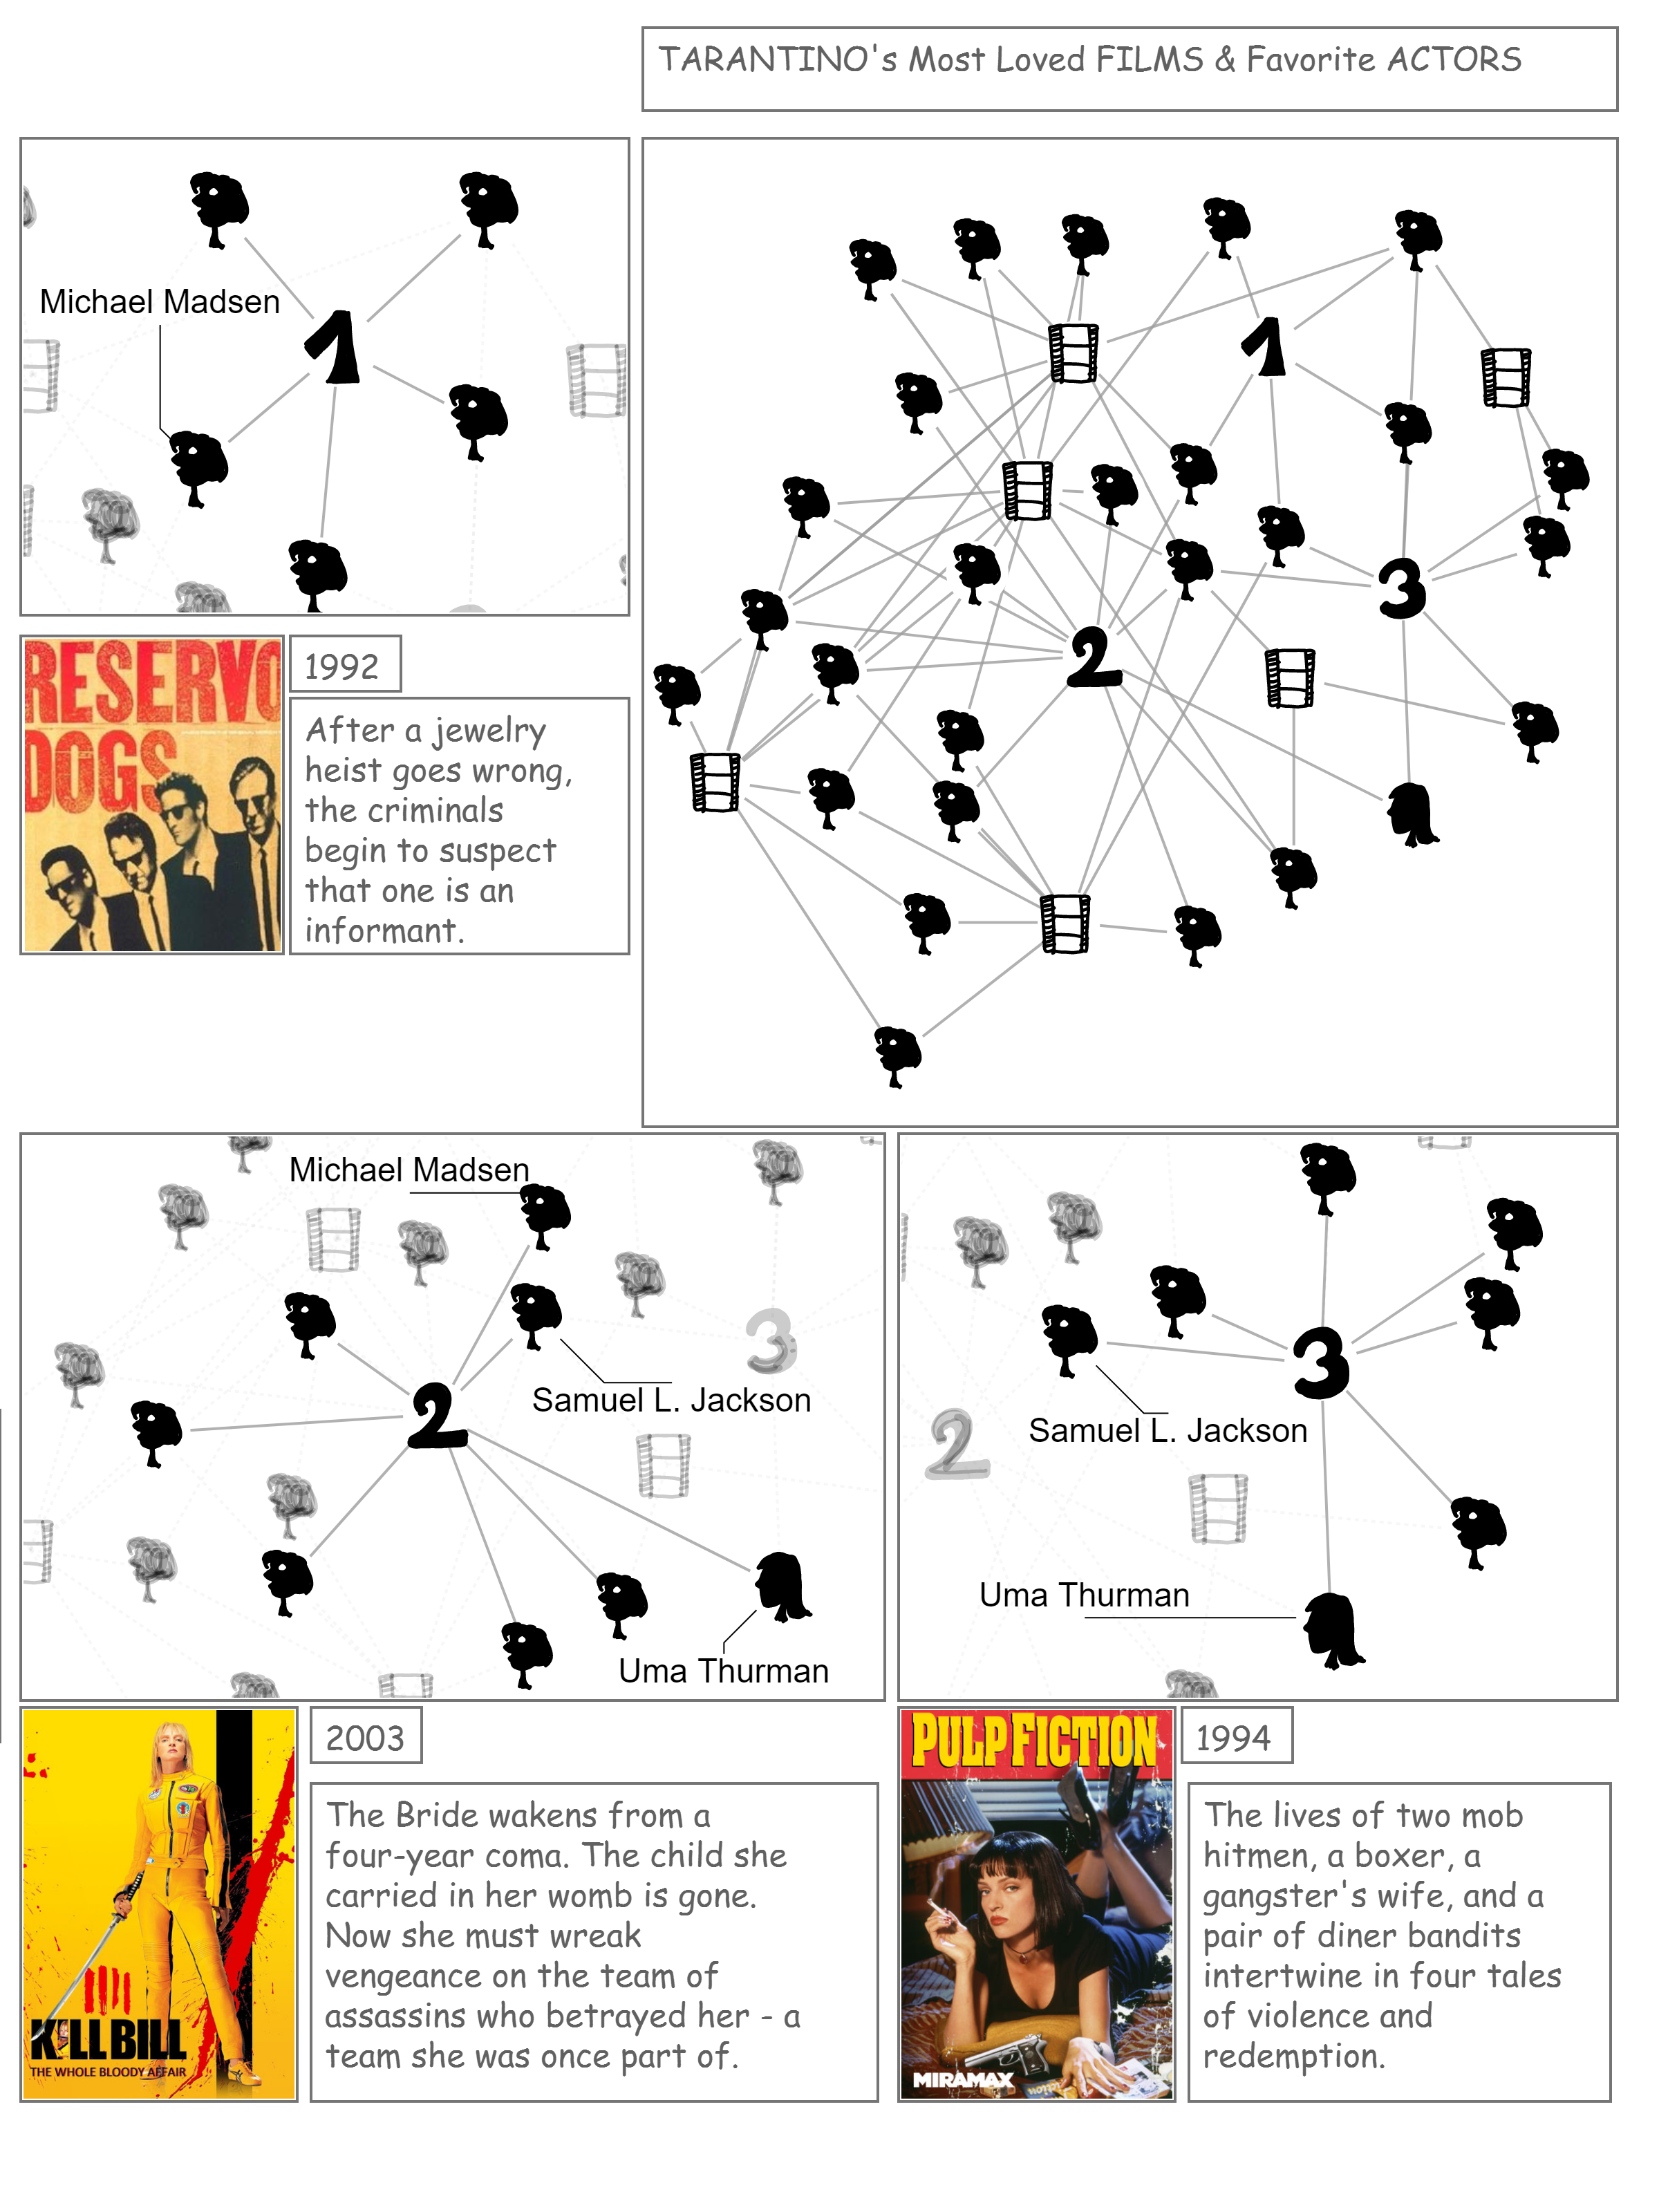
DataToon: Drawing Dynamic Network Comics With Pen + Touch Interaction
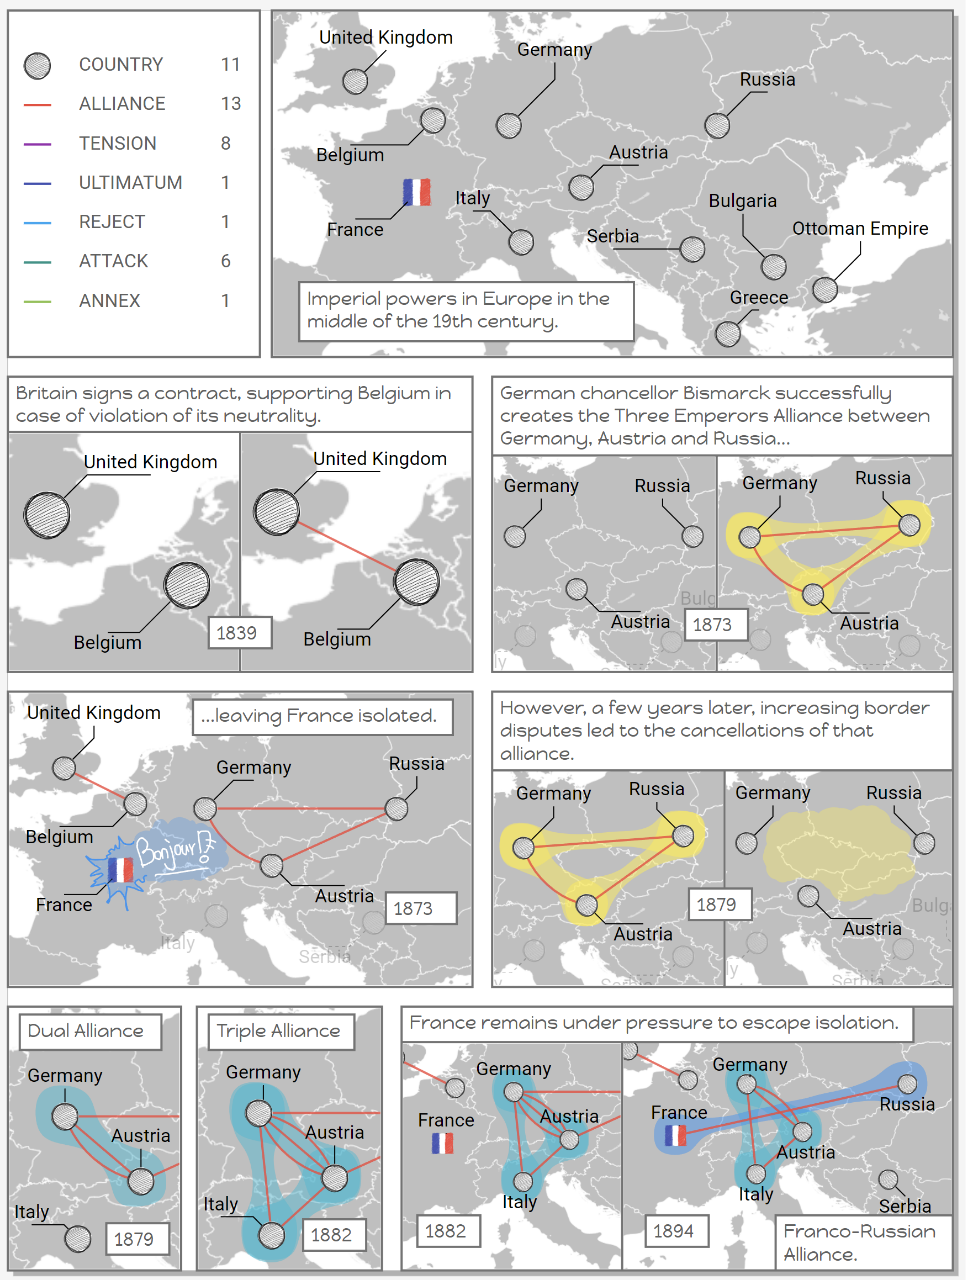
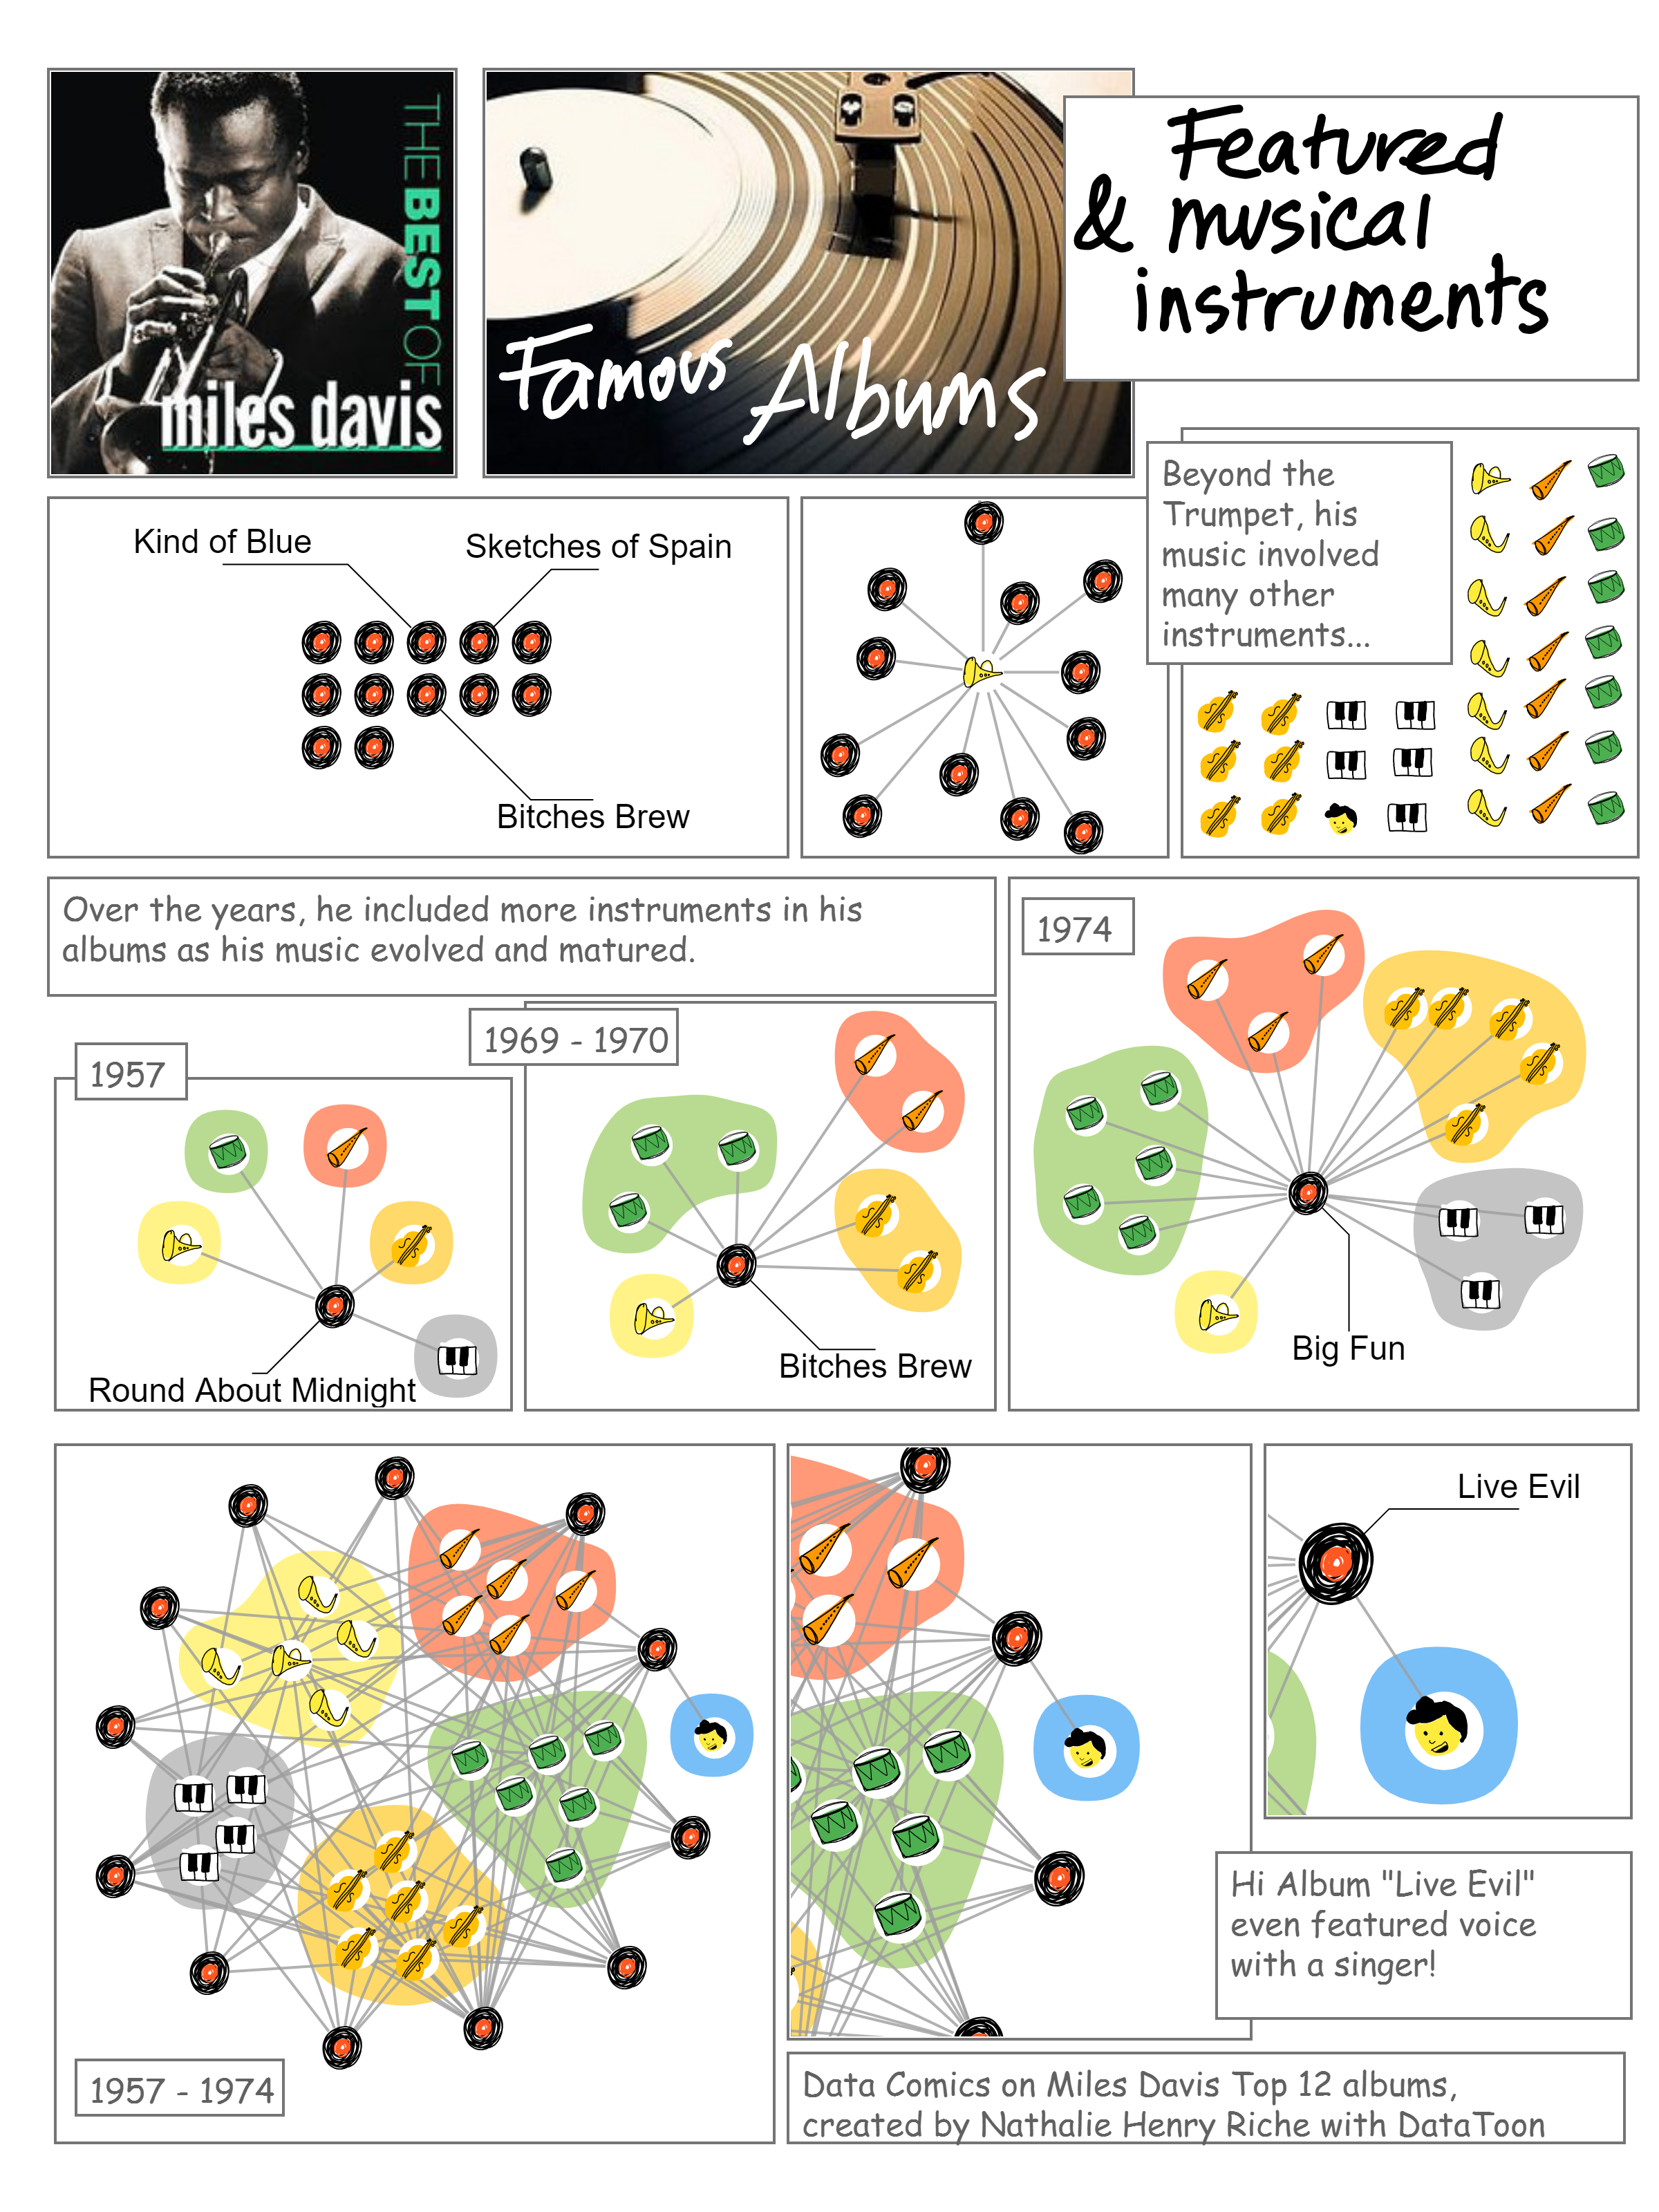
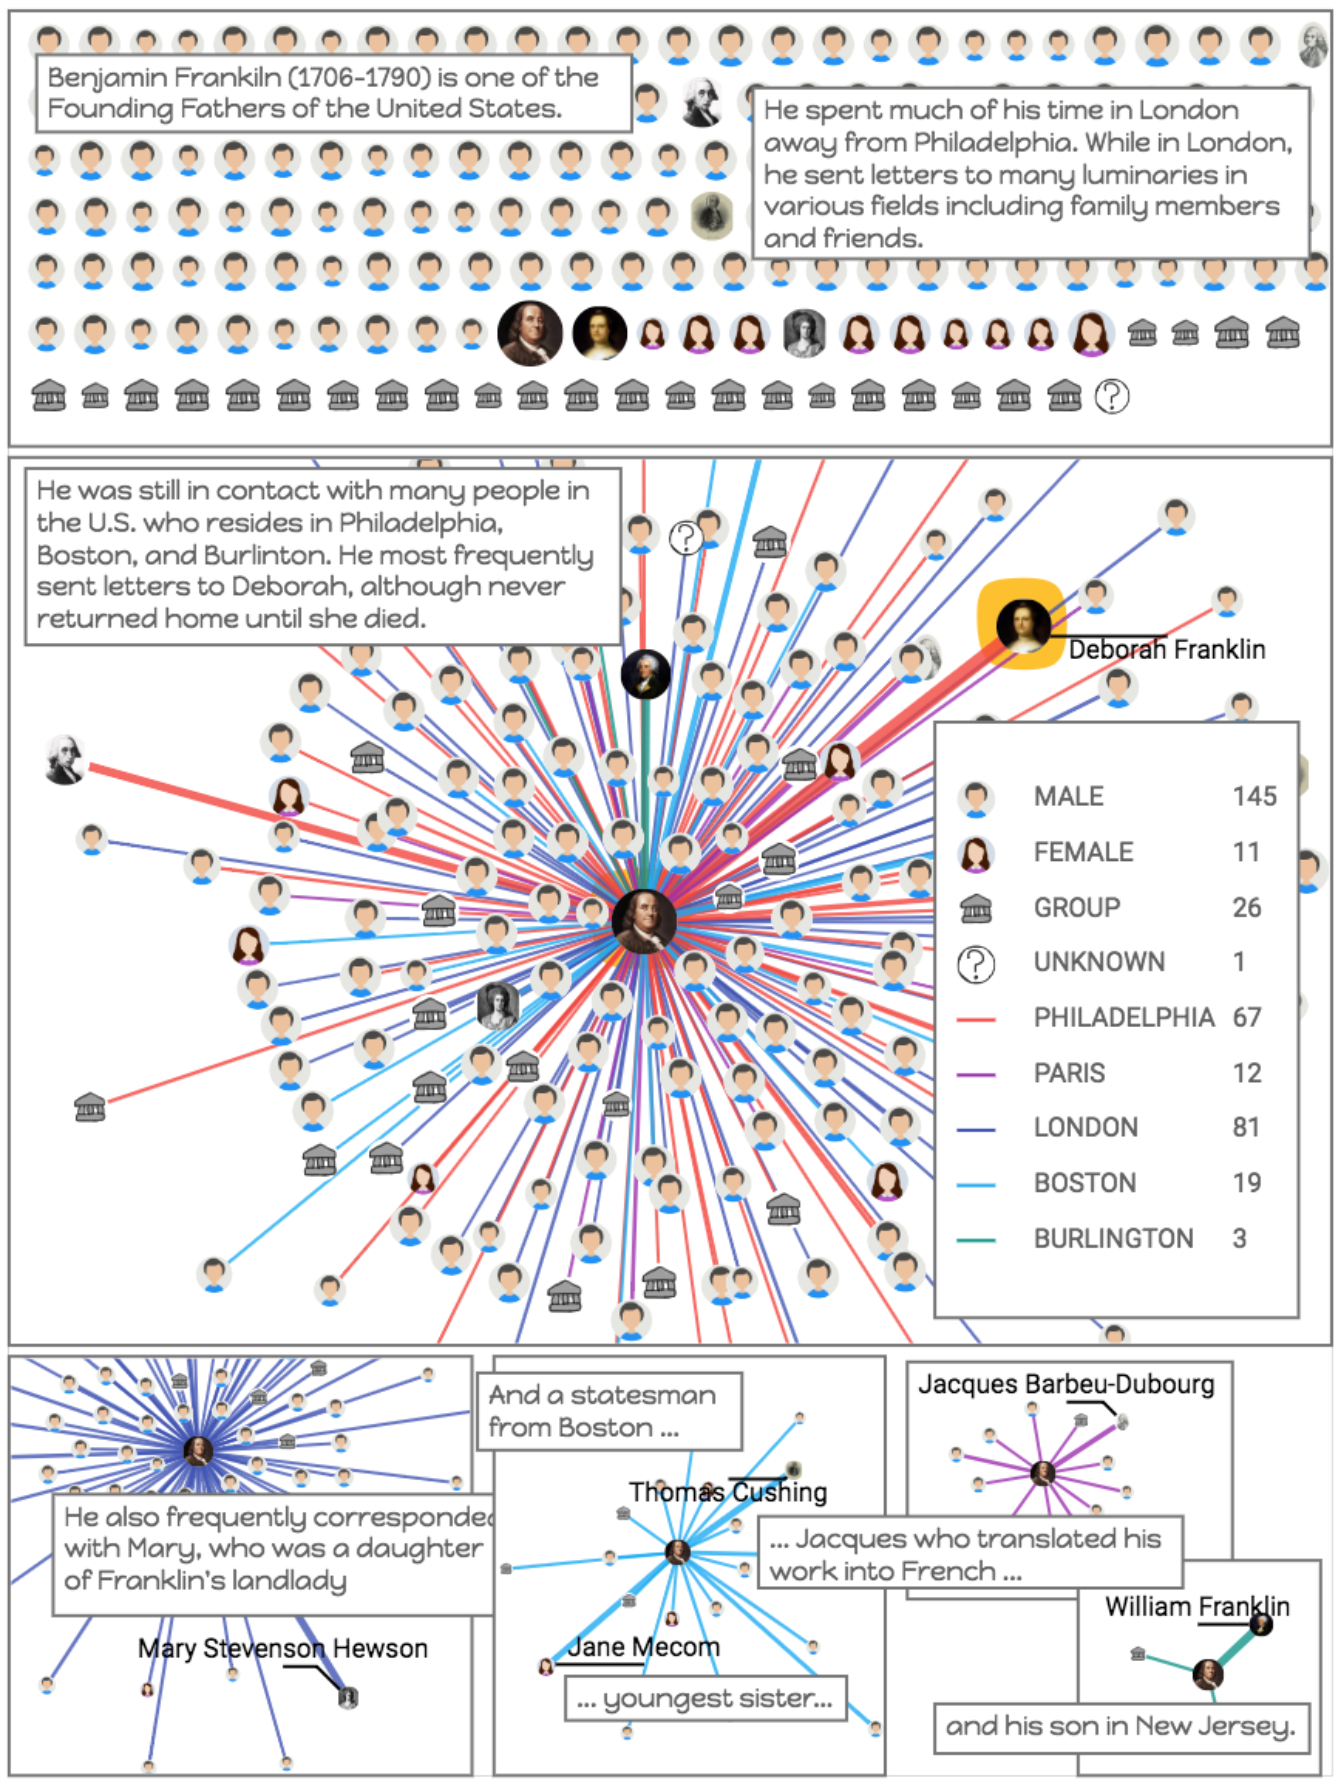
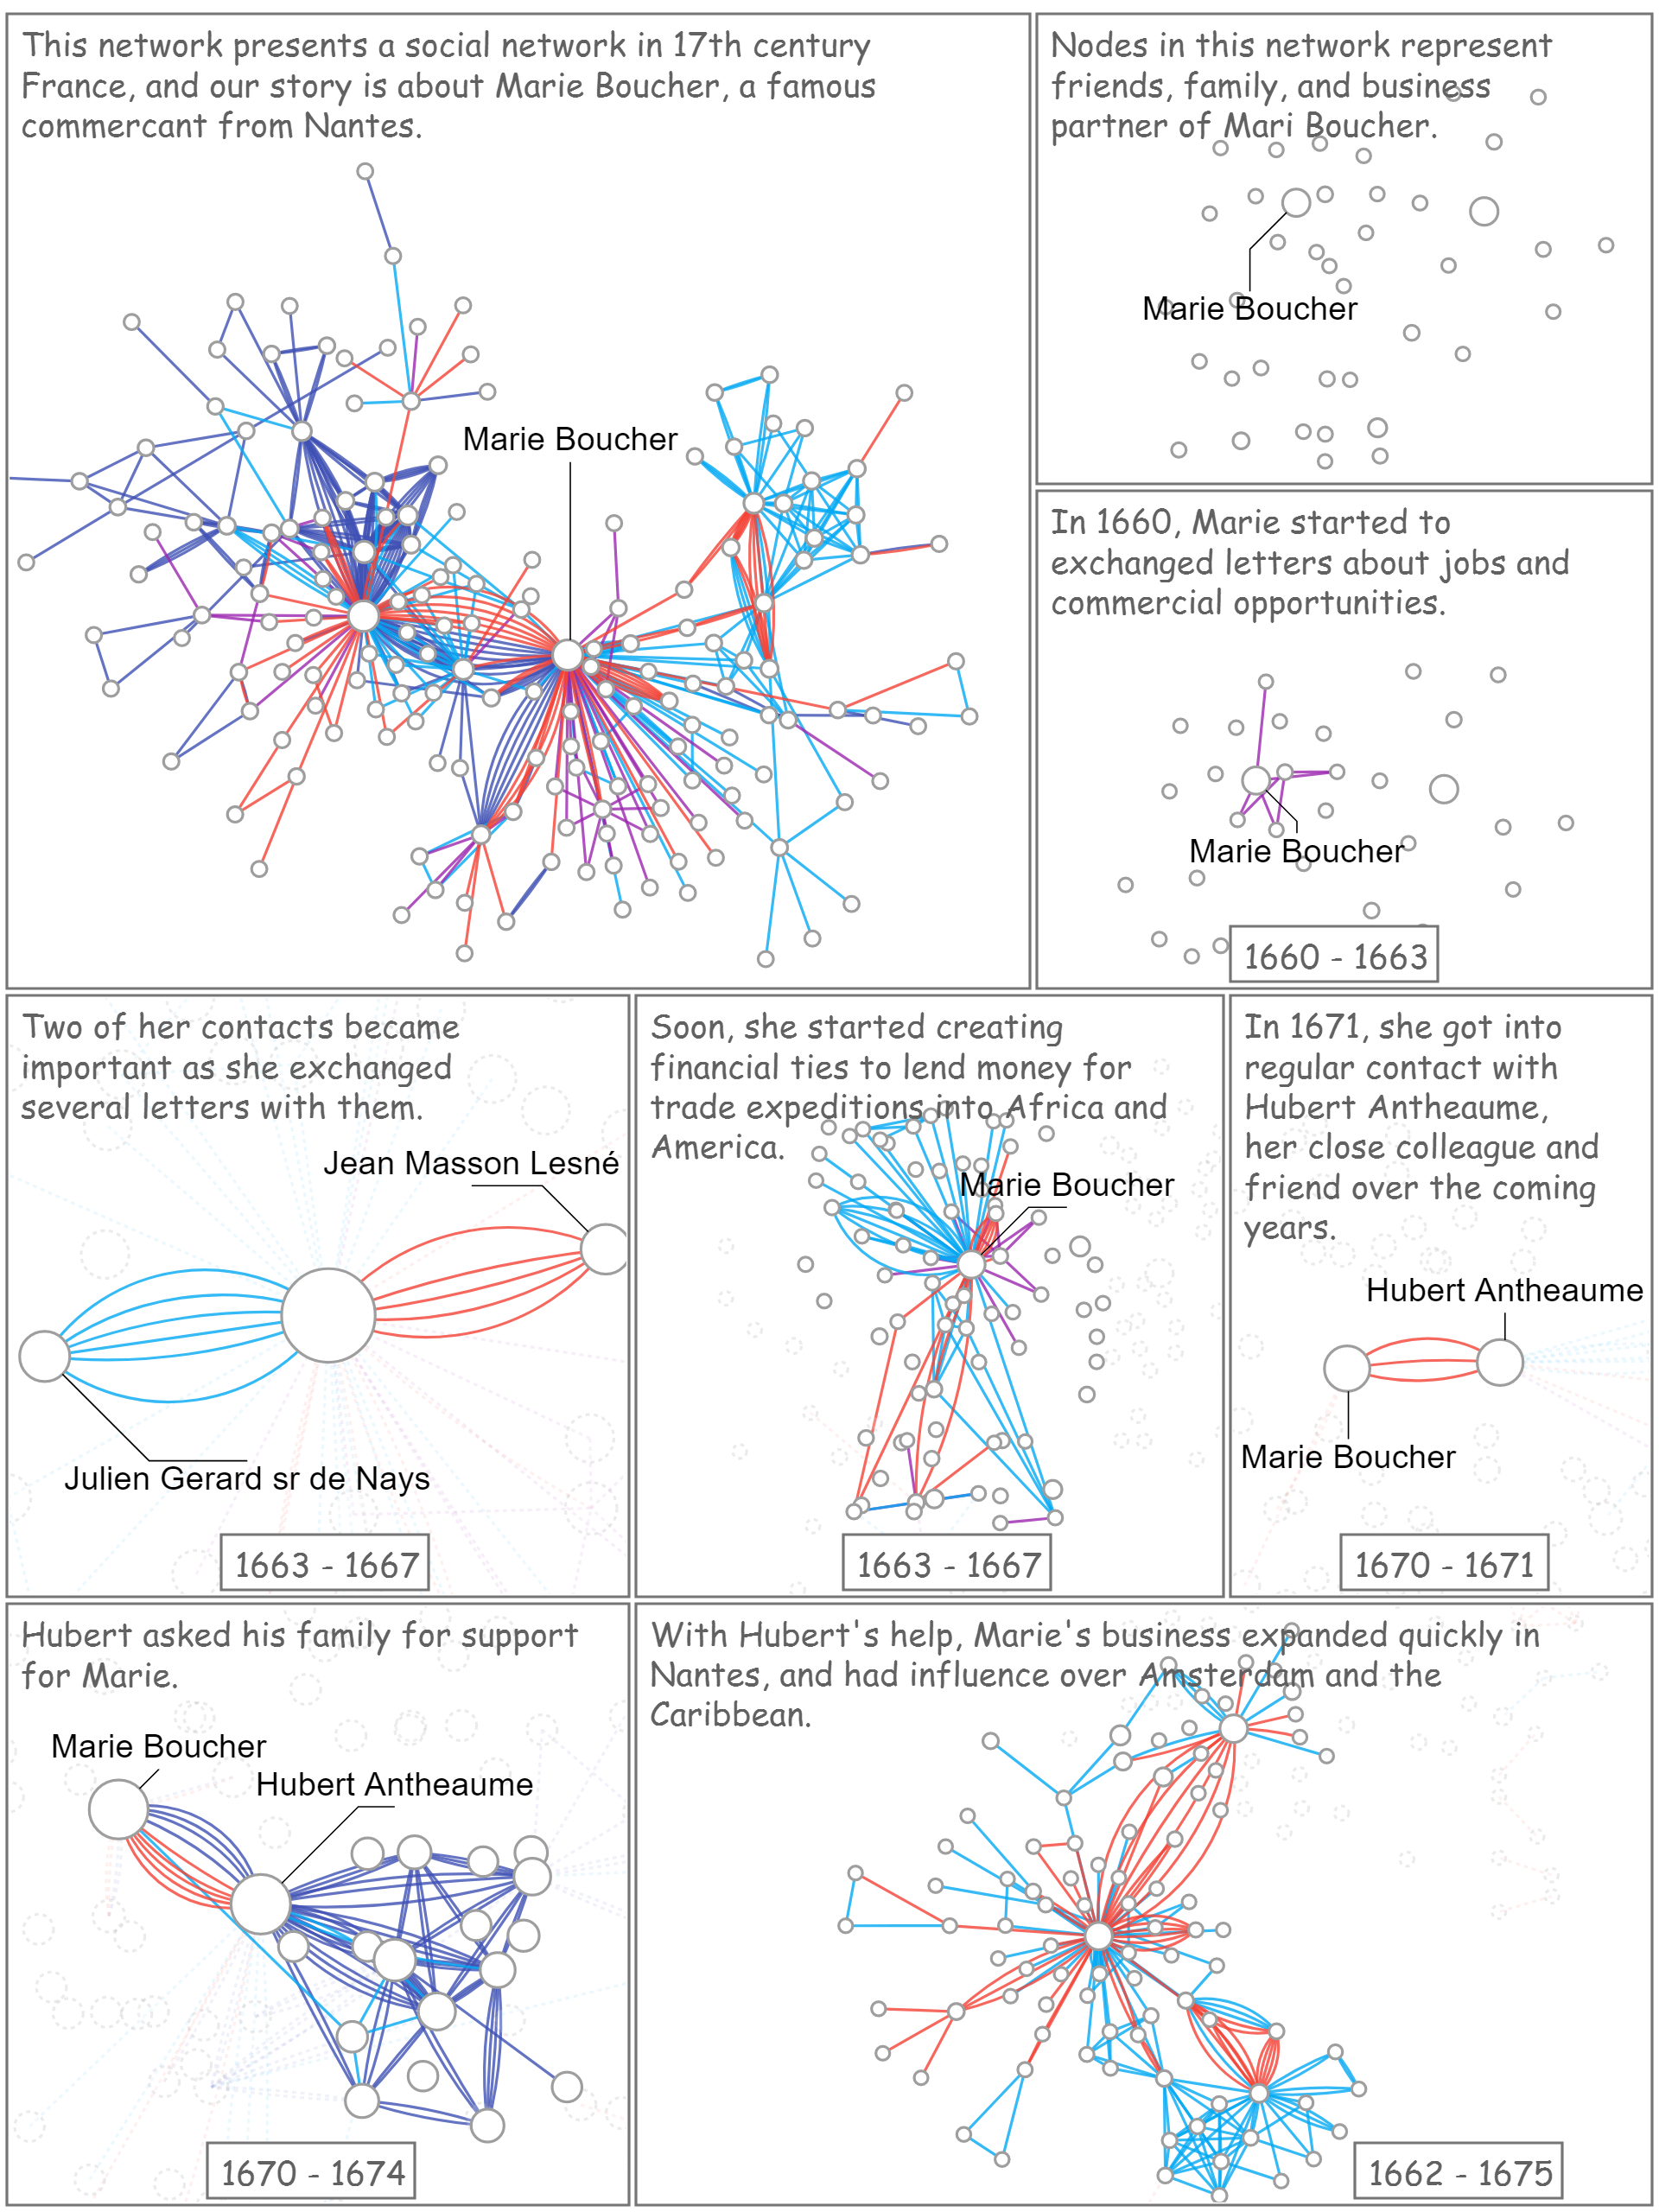
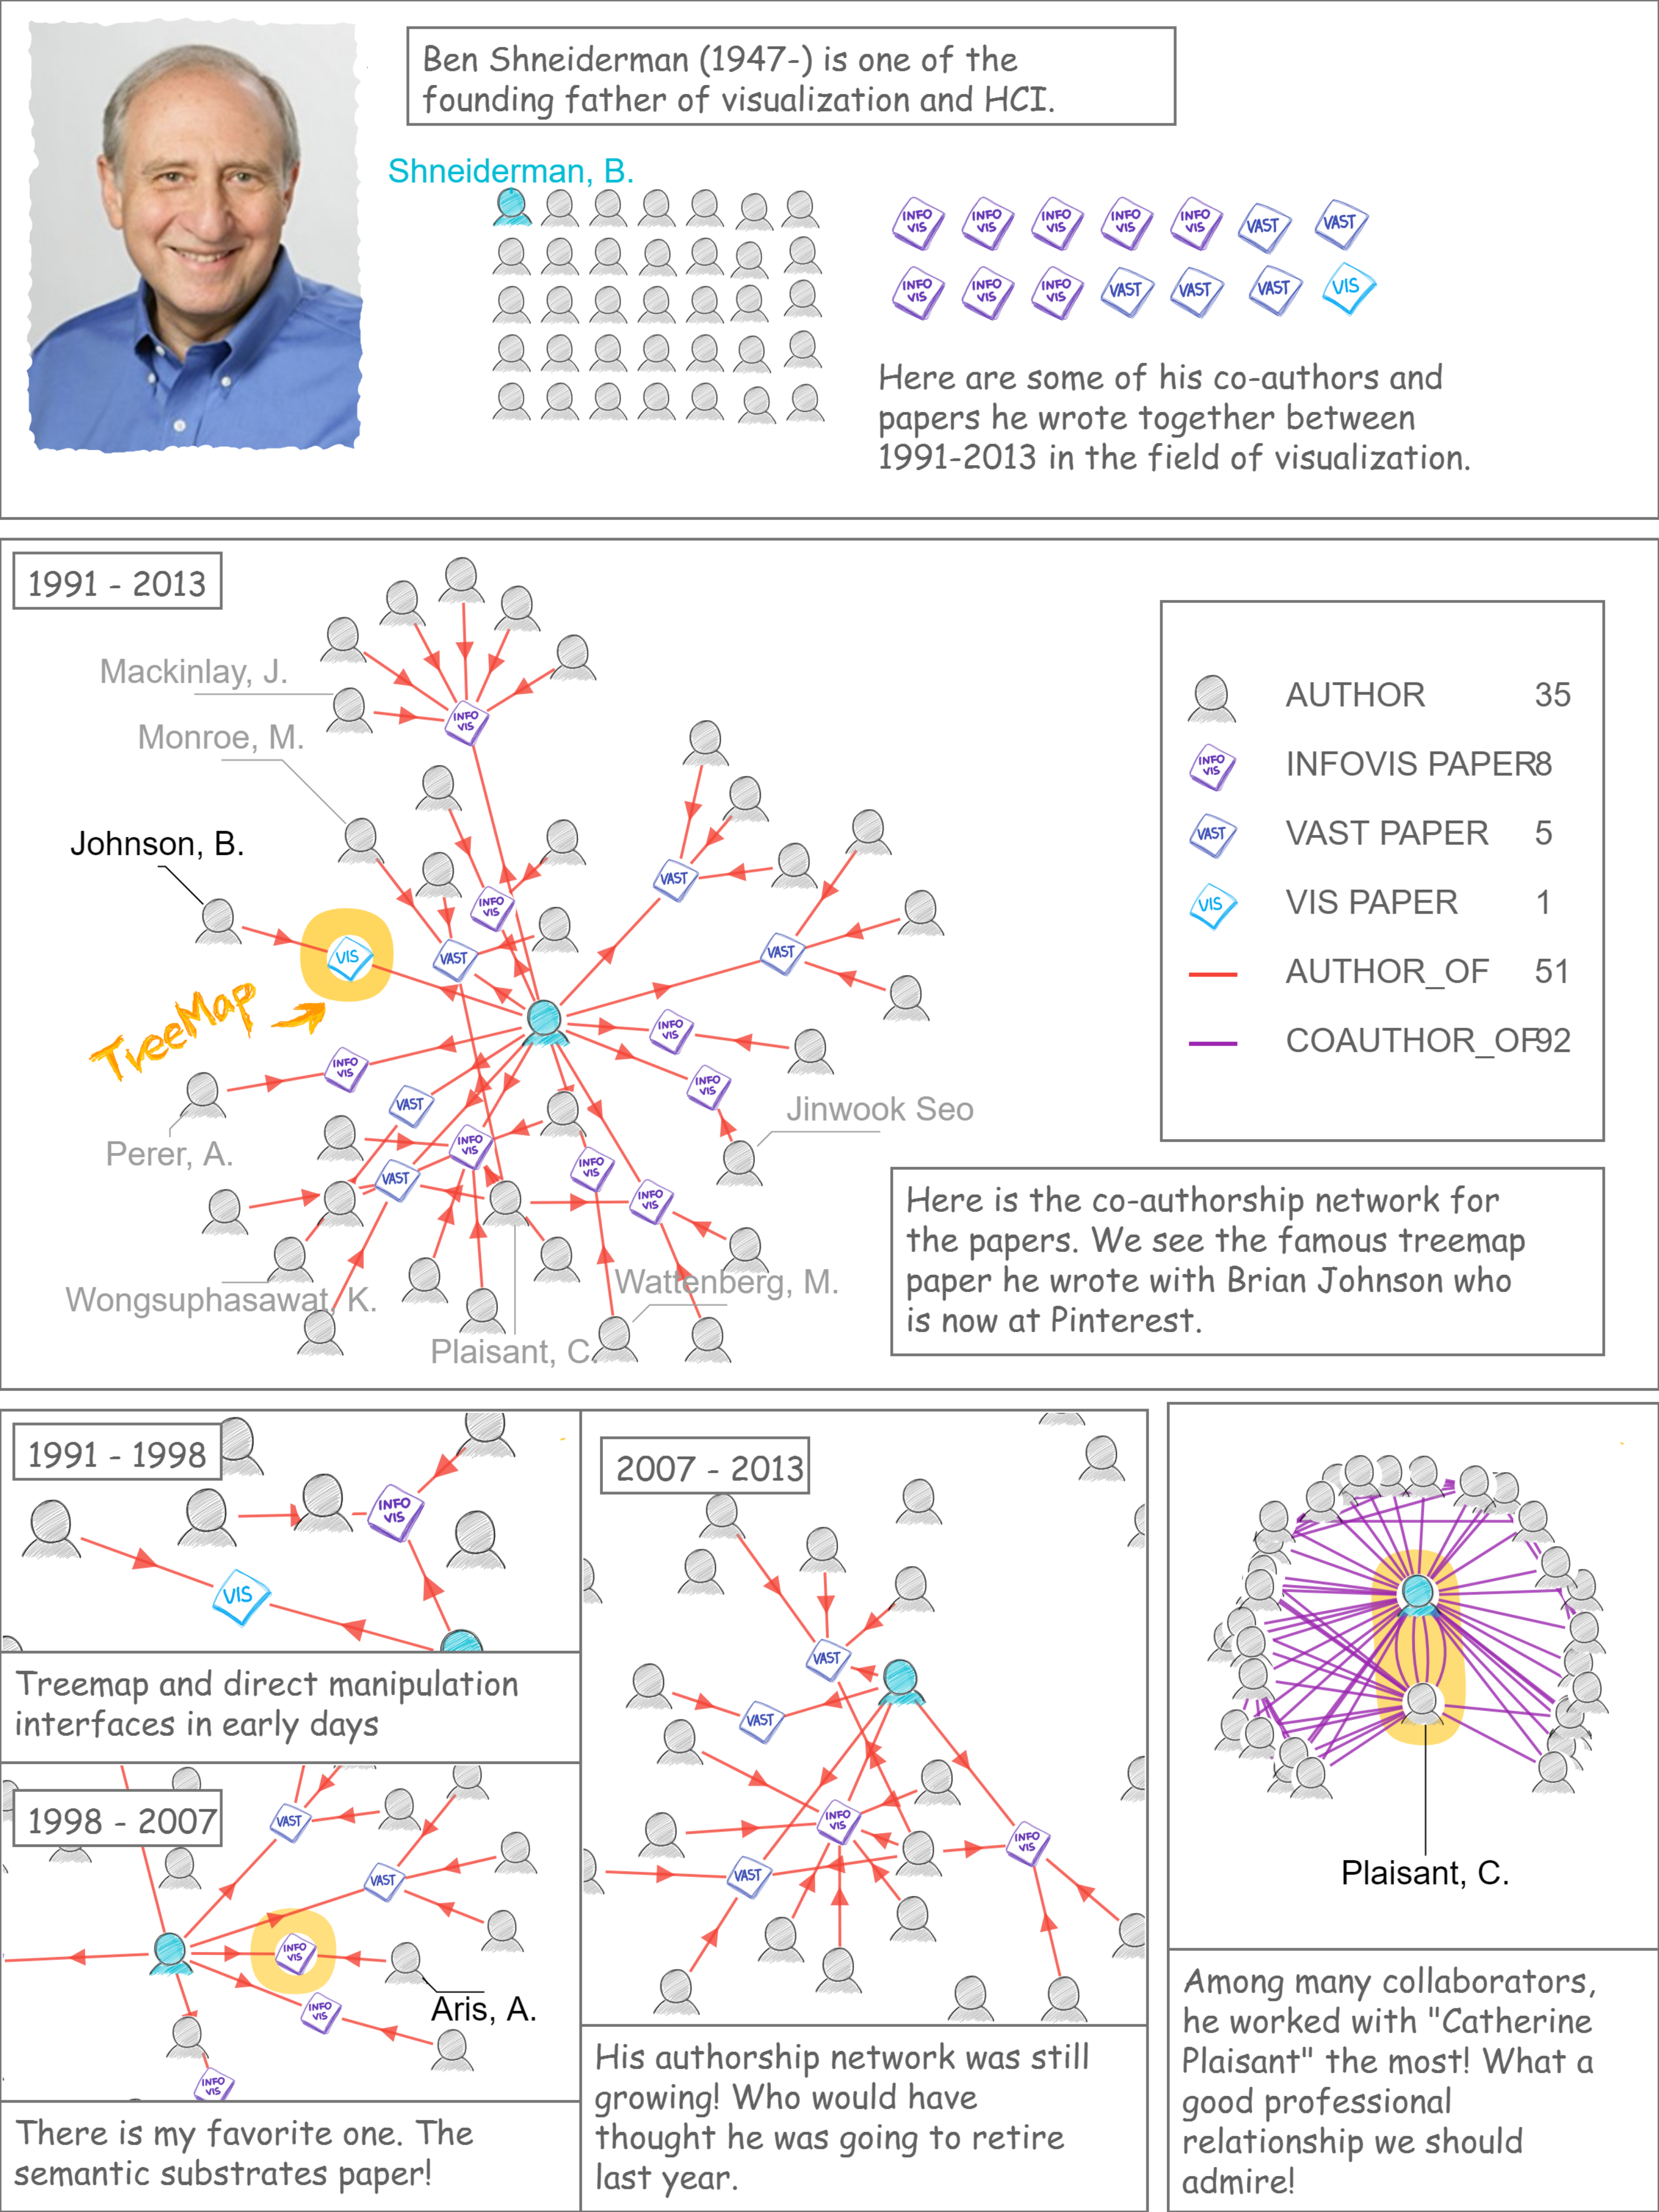
Comics are an entertaining and familiar medium for presenting compelling stories about data. However, existing visualization authoring tools do not leverage this expressive medium. In this paper, we seek to incorporate elements of comics into the construction of data-driven stories about dynamic networks. We contribute DataToon, a flexible data comic storyboarding tool that blends analysis and presentation with pen and touch interactions. A storyteller can use DataToon rapidly generate visualization panels, annotate them, and position them within a canvas to produce a visually compelling narrative. In a user study, participants quickly learned to use DataToon for producing data comics.
DataToon: Drawing Dynamic Network Comics With Pen + Touch Interaction
Video
Tutorial
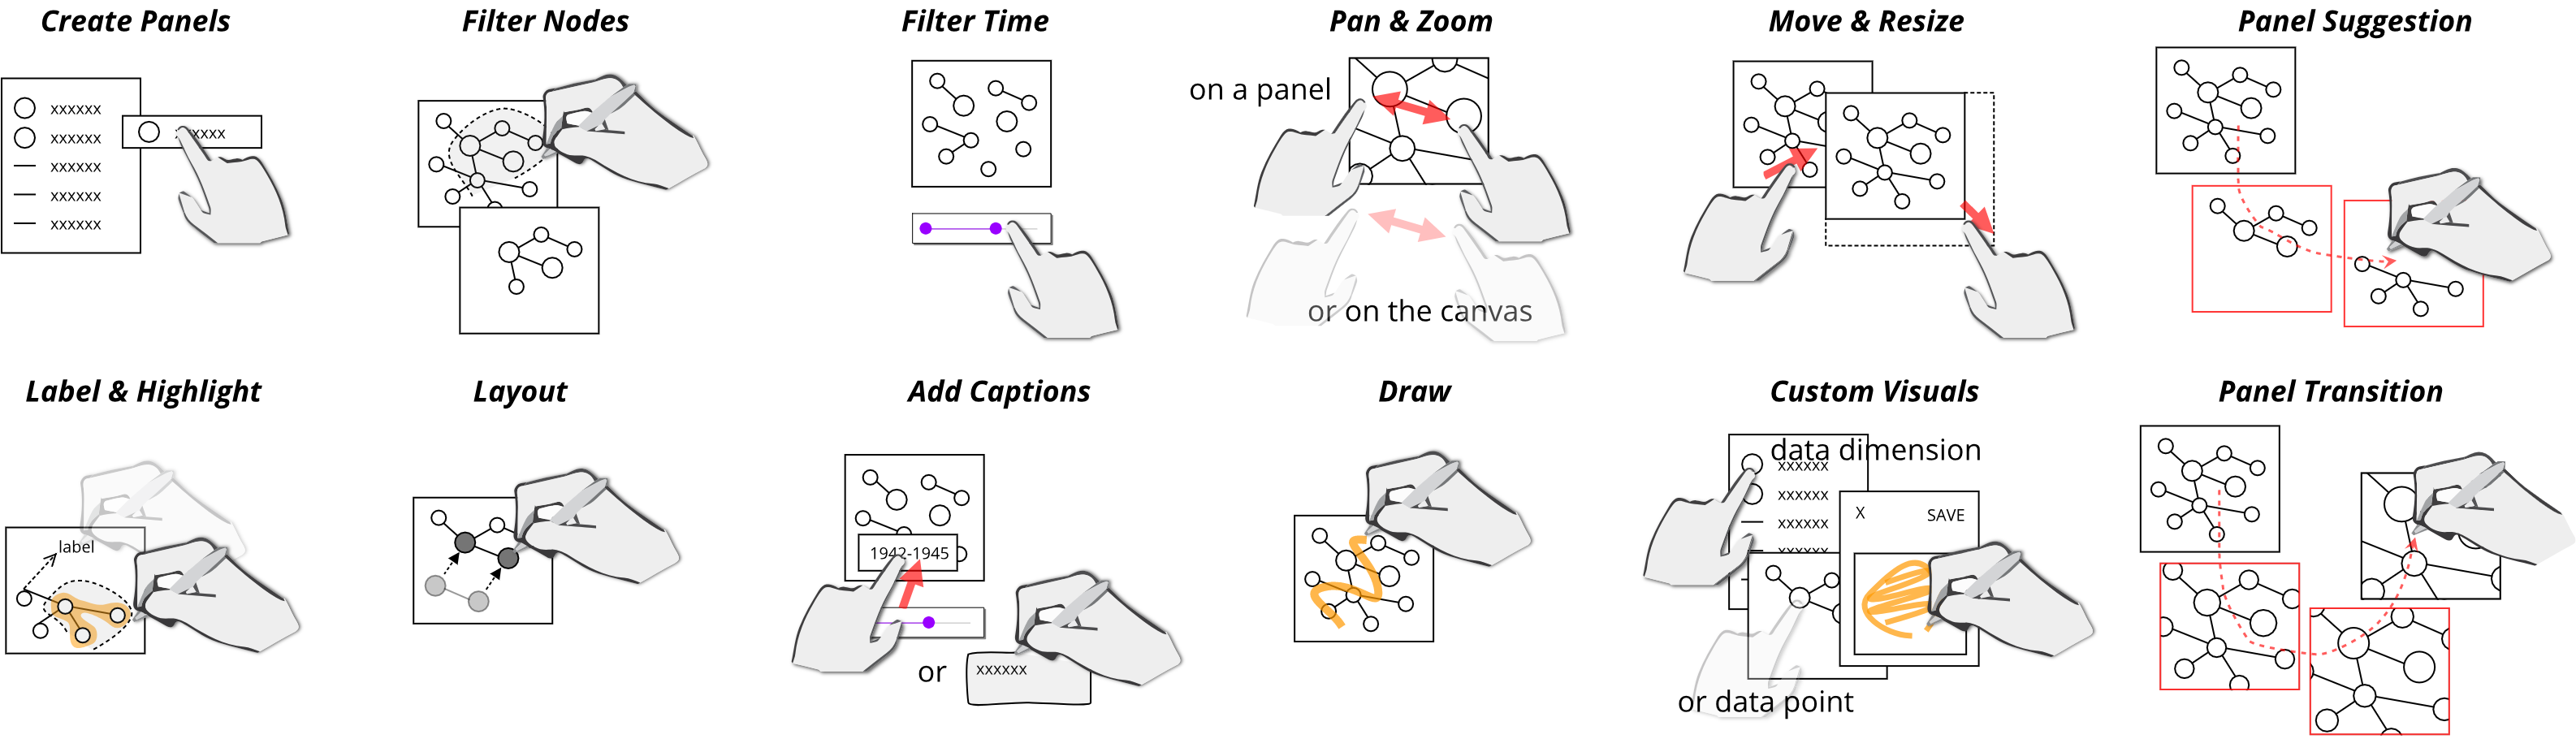
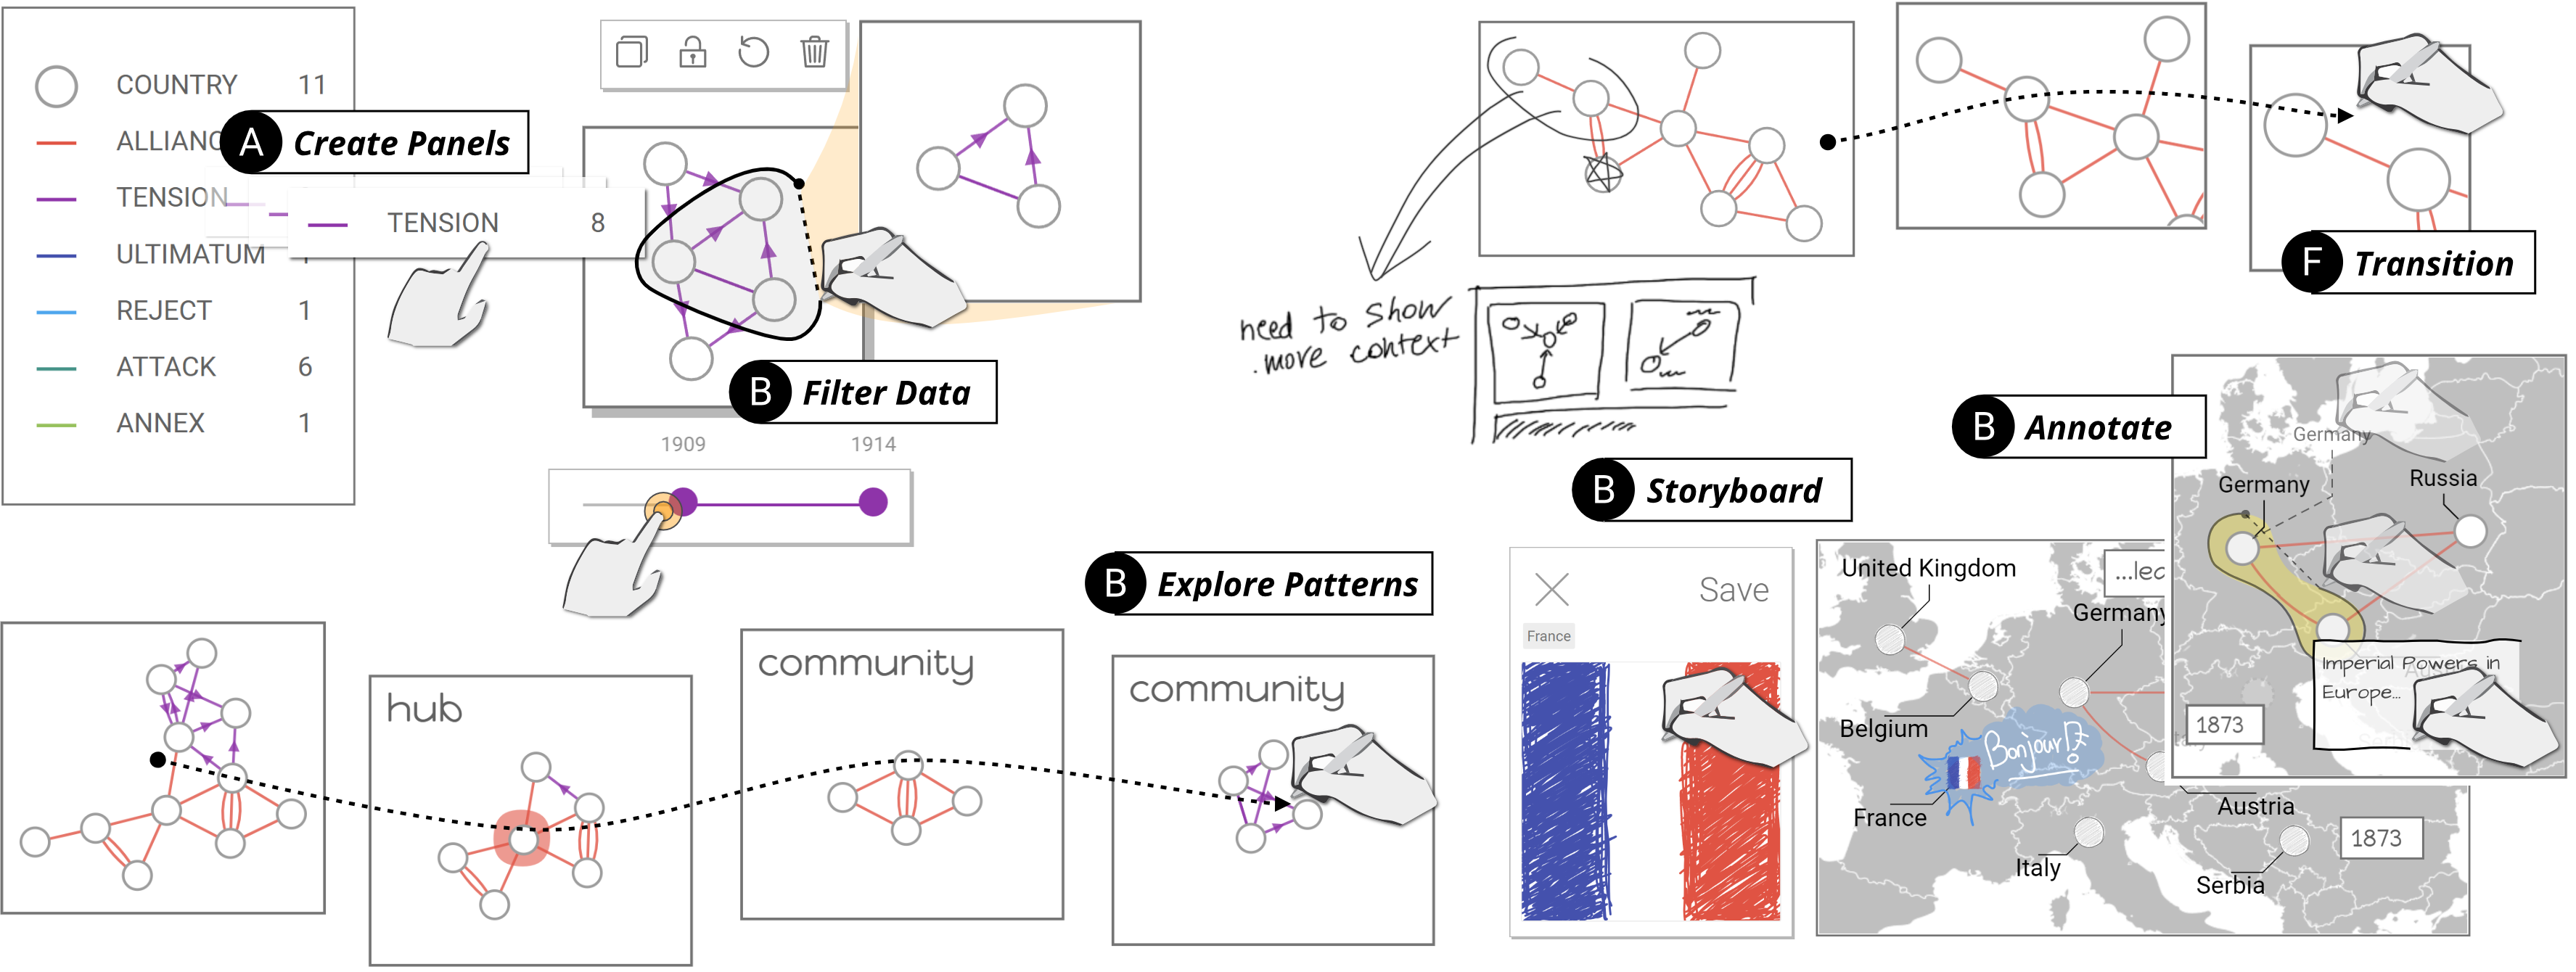
Interaction Design